By: Daniel Morgan, Senior Trust Portfolio Manager
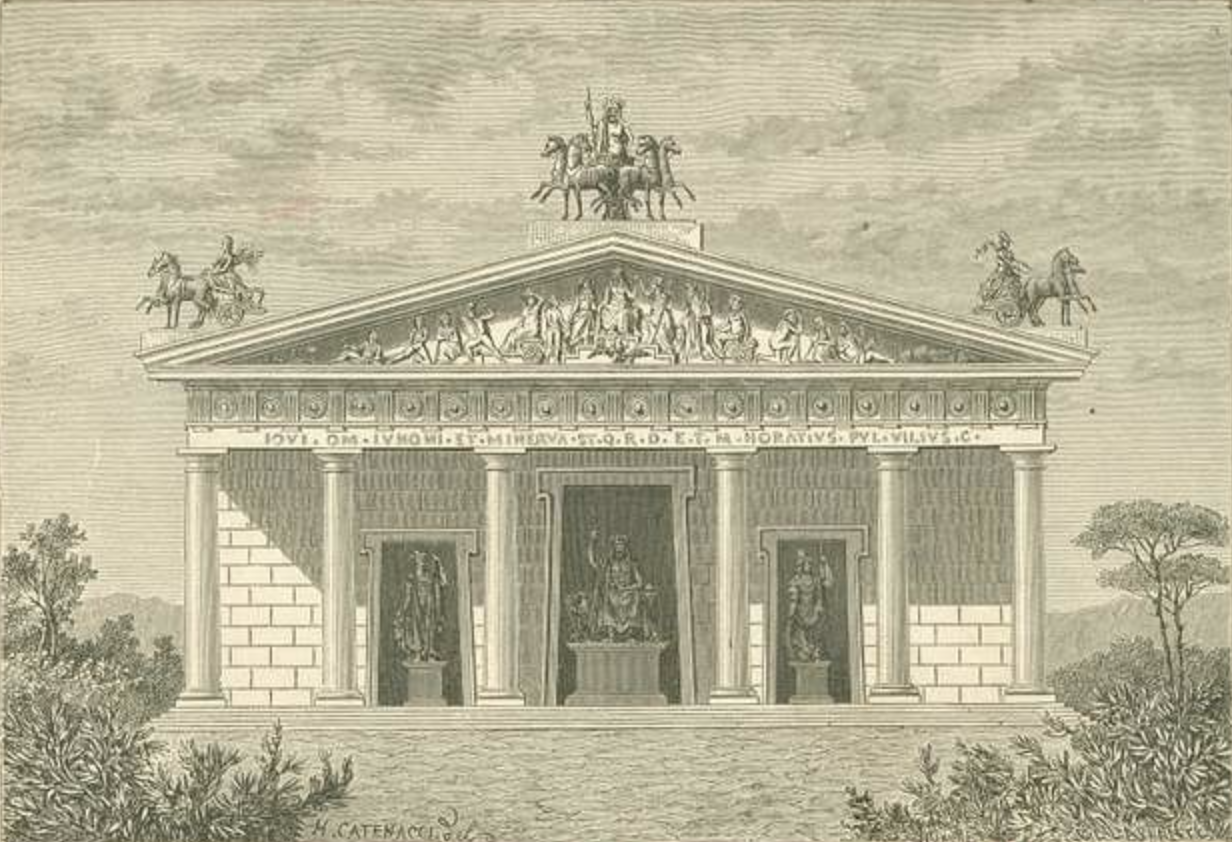
There are many similarities between the Roman Empire that lasted more than 1,000 years and the American Empire that has been in existence for a mere 250 years. Many of the same economic challenges that the Romans confronted Americans are facing today: runaway inflation, food shortages, plagues, porous borders and a bloated bureaucratic government. I thought it might be interesting to compare the Stock Market to the most revered of sacred spots in the Roman Forum the “Temple of Jupiter Maximus.” The Temple of Jupiter Optimus Maximus, also known as the “Temple of Jupiter Capitolinus” or the “Temple of Jupiter, the Best and Greatest” was the most important temple in Ancient Rome, located on the Capitoline Hill. It was surrounded by the Area Capitolina, a precinct where numerous shrines, altars, statues and victory trophies were displayed. The temple, completed by the emperor Domitian, is thought to have lasted more or less intact for more than 300 years, until all pagan temples were closed by emperor Theodosius I in 392 during the Persecution of pagans in the late Roman Empire.
The “Temple of Jupiter Maximus” has six columns that support the temple’s enormous roof and sculptors that adorn the entrance. But when these columns begin to crack, eventually the temple will collapse. Like the six columns that hold the temple’s roof in the air, the Stock Market has supporting columns that keep it upright too. When these key foundational pillars – Inflation, Market P/E Ratio, Interest Rates, Gross Domestic Product (GDP) Growth, Profit Growth, and Technical Support – propelling the market begin to crumble, the stock market will come down.
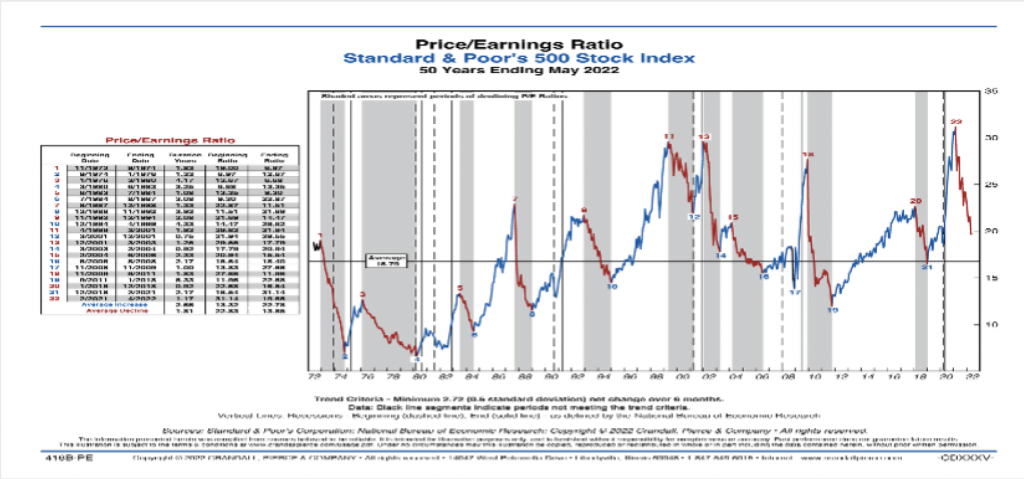
First, we must understand the inverse relationship between inflation (column one) and the market P/E ratio (column two). Unlike in YR2000 when inflation was low, today the market is starting to come to grips that higher prices may be here to stay. In the past during periods of higher inflation (as seen during the 1970’s Stagflation cycle), and as indicated by the recent increase in the Consumer Price Index (CPI) (June’s CPI was +9.1% YoY), the market’s P/E ratio typically will compress. Conversely, during times of low inflation the market can tolerate higher P/E multiples (as seen during the late 1998- 2000 period). Therefore, there is a negative correlation between Inflation and Market P/E valuations. The S&P 500 Index P/E is 18x, which is above the long-term 50-year average. Therefore, with most growth stocks trading at high P/E multiples, sustained inflation causes a re-evaluation of their multiples.
Second, the direction of interest rates (column three) is a key factor in determining whether the market goes up or goes down. The old saying “Don’t fight the Fed” comes into play here. “Don’t fight the Fed” is an old investor saying that cautions you to align your investments with the current monetary policies of the Fed rather than against them. The Fed was created in 1913 to make the financial system of the U.S. more safe, stable, and flexible. Advocates of the “Don’t fight the Fed” investing theory suggest working with the Fed’s policies by investing more aggressively when the Fed is lowering rates. Conversely, when the Fed raises rates, investors are cautioned to take a more defensive posture. The saying suggests that you should keep your money in stocks (up to your level of risk tolerance) when the Fed’s Federal Open Market Committee (FOMC) is actively lowering rates or keeping them low. Although the Fed cut might occur when the economy is experiencing slow growth or in a recession, the accommodative or easy monetary policy would likely lift the economy out of its challenging period, which would spur more risk-taking and equity purchases.
Third, typically stock market and economic performance or GDP growth (column four) are aligned. Thus, when the stock market is performing well, it is usually a function of a growing economy. Economic growth can be measured in several ways, but one of the most prominent is by following GDP. Approximately two-thirds of GDP output is driven by consumer spending. For the 2Q22, GDP dropped -0.9%, while personal consumption rose just +1.0%. This is the second consecutive quarter that GDP has fallen (1Q22 GDP was down -1.6%) signaling that the economy is technically in recession. This came at a surprise after GDP rose 5.7% in FY2021. When GDP is growing, individual businesses are producing more and usually expanding. Expanding business activity usually increases valuations and leads to stock market gains. Often, consumers spend more during bull markets because they are making more income from the effects of a strong economy and they also feel wealthier when they see their portfolios rise in value. During bear markets, the economy is usually not doing as well and spending recedes. When consumers buy more, businesses that sell those goods and services choose to produce more and sell more, reaping the benefit in the form of increased revenues. Thus, this rise and fall in consumer spending directly impacts corporate revenues and profits, which ultimately drives stock prices.
Fourth, S&P 500 Index profit growth (column five) is one of the biggest factors impacting stock price direction. Typically, when companies in the S&P 500 Index are increasing their profits this will propel stocks higher. Inversely, when profits are trending downward this puts a downdraft on S&P 500 stock prices. Often, strong earnings growth can allow S&P 500 companies stock prices to overcome even a Fed tightening cycle. However, profit expectations appear at risk with the likelihood of a recession growing. Expect downward revisions to consensus S&P 500 EPS estimates for 2022 that call for profit growth of +10.90%, to be followed by growth in 2023 of +9.31%. For now, S&P profit growth is still positive. However, if profits were to turn negative that would severely pressure the market’s P/E multiple placing further downward pressure on stock prices.
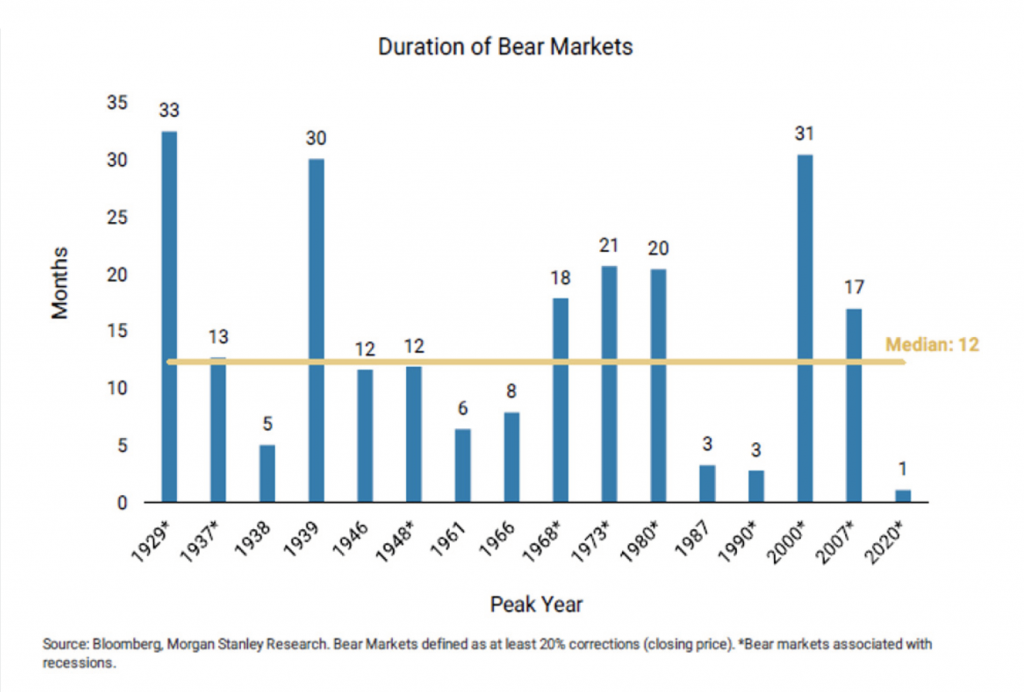
Fifth, technical strength or weakness of the market (column six) has a direct impact on the direction of major market benchmarks. Technical analysis is a trading discipline employed to evaluate investments and identify trading opportunities in price trends and patterns seen on charts. Technical analysts believe past trading activity and price changes of a security can be valuable indicators of the security’s future price movements. All the major benchmarks – Dow Jones Industrial Average, S&P 500 Index and NASDAQ Composite – are trading far below previous highs set in January 2022. Both the S&P 500 Index (-17% YTD) and NASDAQ Composite (-24% YTD) are currently down nearly 20% or more YTD, which technically speaking means these benchmarks are in a “Bear Market.” A Bear Market is when stocks on average, fall at least 20% off their highs. Typically, a Bear Market will last approximately 12 months, while this current Bear Market is about six months old. Unfortunately, at this point most of the market technical indicators are pointing negative and are simply illustrating all the investor worries – Fed hikes, Inflation and Recession – hovering over the market.
In summary, what conclusions can we make from this comparative analysis of the “Temple of Jupiter Maximus” versus the Stock Market. At this time it appears that five pillars – Market P/E Ratio, Interest Rates, Inflation, GDP and Technical Support – are under heavy pressure. While just one of the pillars, Profit Growth, is still standing strong. Can this sturdy pillar withstand all the negative sentiment in the marketplace, or will it succumb to the downdraft? Will one or two of the five pillars that are negative turn positive and create additional support for the markets? For example, if inflation starts to peter out or the Fed pivots and decides to begin to lower interest rates. Only time will tell!