
By: Dan Morgan, Senior Trust Portfolio Manager
It appears funds are flowing away from high multiple Tech growth stocks toward defensive names. Technology stocks seem to sell off when any news of Fed tightening surfaces or concerns about future economic growth arise. The “Dot.com Bubble” was characterized by the end of a massive spending boom to convert all software to be Year 2000 (Y2K) compliant and the tail-end of a huge buildout by corporate America to create an Internet presence. When IT spending started to dry up at the 2H2000, followed by the 9/11 Terrorist Attack the following year, this resulted in a massive devaluation of the Technology sector. But, despite today’s “Tech Wreck” sell-off appearing very similar to the “Dot. com Bubble” there are many important broader Tech industry indicators that are much different that point to a positive outlook for the sector going into FY 2022.
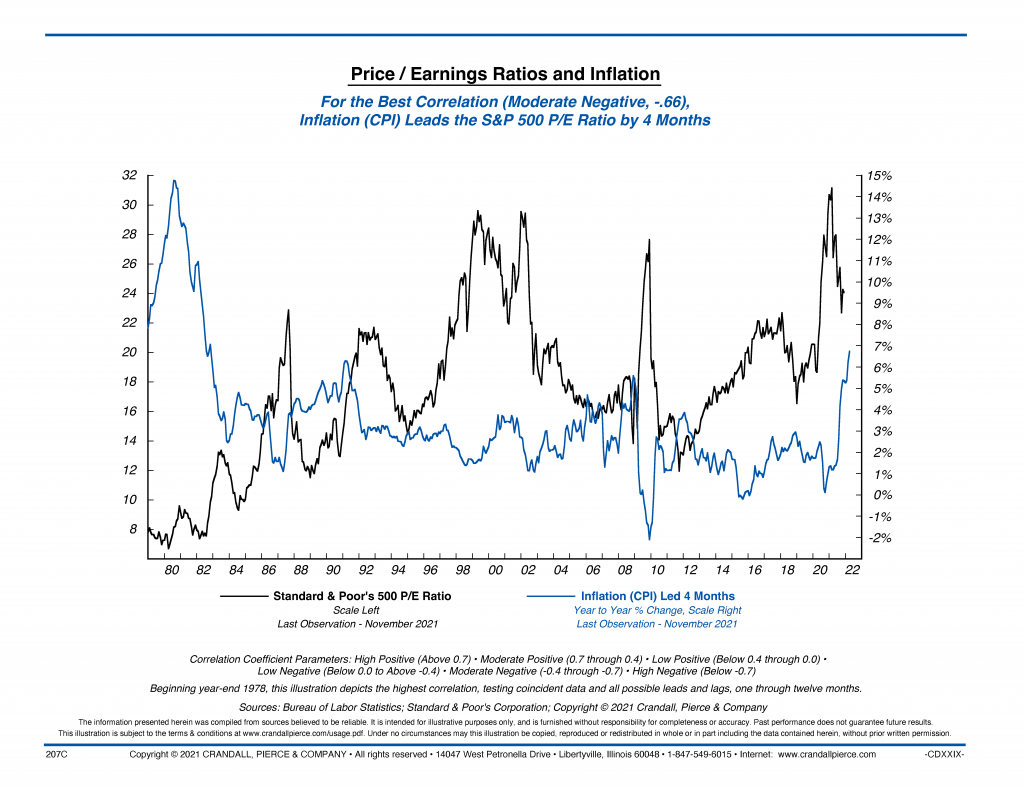
First, we must understand the inverse relationship between inflation and the market price over earnings (P/E) ratio. Unlike in YR2000 when inflation was low, today the market is starting to come to grips that higher prices may be here to stay. In the past during periods of higher inflation (as seen during the 1970’s Stagflation cycle), and as indicated by the recent increase in the Consumer Price Index (CPI), April’s CPI was 8.3% YoY, the market’s P/E ratio typically will compress. Conversely, during times of low inflation the market can tolerate higher P/E multiples (as seen during the late 1998-2000 period). Therefore, there is a negative correlation between inflation and market P/E valuations. The NASDAQ Composite P/E is 38x, which is still fairly lofty. Therefore, with most Technology stocks trading at high P/E multiples, sustained inflation causes a re-evaluation of their multiples!
 Spending on Technology continues to be strong. Worldwide IT spending is projected to total $4.4 trillion in 2022, an increase of 4% from 2021, according to the latest forecast by Gartner, Inc. As the Technology sector has been impacted by geopolitical disruption, inflation, currency fluctuations and supply chain challenges are among the many factors, yet contrary to what happened at the start of 2020, CIOs are accelerating IT investments as they recognize the importance of flexibility and agility in responding to disruptions. As a result, purchasing and investing preference will be focused in areas including analytics, cloud computing, seamless customer experiences and security. Inflation impacts on IT hardware (e.g., mobile devices and PCs) from the past two years are finally dissipating and are starting to spill over into software and services. Software spending is expected to grow 9.8% to $674.9 billion in 2022, and IT services is forecast to grow 6.8% to reach $1.3 trillion.
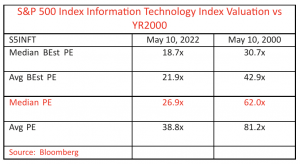
How do the valuations in the Technology Sector compare to the Dot.com Bust of 2000? Today the S&P Information and Technology Index trades at a Median P/E of 26.9x, compared to the peak during the Dot. com Craze in 2000, when the Tech Index traded as high as 62x Median P/E. Therefore, compared to YR2000 today’s Technology sector does not appear to be as overvalued. This compares to the S&P 500 at 20x Median P/E. Today, this represents a Tech multiple premium over the broader market of 1.35x, which is not excessive.
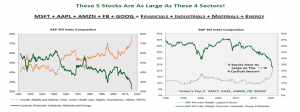
Finally, back in YR2000 many of the large mega-cap Technology stocks like Apple, Alphabet, Microsoft and Amazon were not nearly as well capitalized as they are today. In YR2000, many Technology stocks were not profitable and had unproven business models. Amazon for example, went public in 1997 and did not get out of the “red” until posting a profit in FY2003 of just $35.3 million. In FY2021, Amazon posted a profit of $33.3 billion. At the moment, not only are these bell-weather Technology companies combined market cap larger than entire industry groups in the S&P 500 Index, but these names hold huge piles of cash on their balance sheets – Apple $202.6 billion, Alphabet $169.2 billion, Microsoft $132.4 billion, and Amazon $96.0 billion. Many of these top Technology stocks could use their cash to weather any storm or make acquisitions to boost future growth.